To the right my thermometer for colouring purposes. Maybe bigger increments would have been good. Ie. 0 - 5 - 10 - 15 ... instead of 0 - 4 - 8 - 12 ... Then only the real hot days in July and August would have been pink. But this is what I did.
The first three months. In the middle of January I got the idea of three-coloured days for maximum, minimum and average temperatures, instead of uniform average temperature codes. But I waited until February to implement it. It's nicer, but a bit more fuzzy.
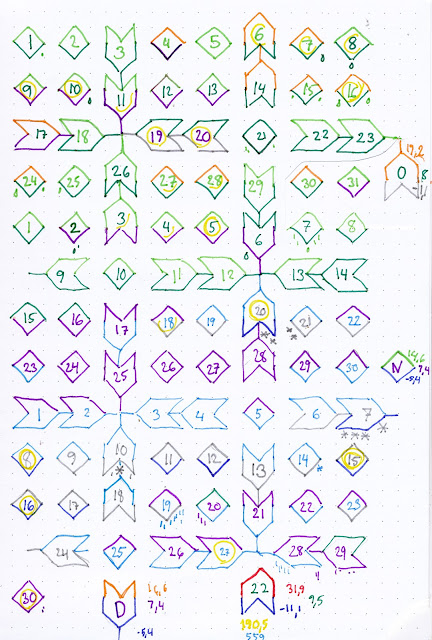
The yellow dates in January means a day with more than one hour of continuous sunshine - this is denoted by circling the date in yellow from February 1st onwards. Drops mean rain, asterisks mean snow, and small slashes lots of wind.
April - May - June:
July - August September - in August the temperatures hit a high of 31.9 Celsius; it was hot.
October - November - December. You can see the first frost in October (grey contour on Oct. 19); always around our autumn holidays.
And I just saw an error. Decembers minimum should be -11.1 Celsius.
Maximum temperature 31.9 degrees (August 4th) Minimum -11.1 ( December 16th). Average 9.5.
In total 1910 hours of sunshine. 562 mm of precipitation. Updated since I drew the last lines here.


Pretty - but a lot of work.
SvarSletI agree. It is pretty, and i'm not sure i could keep up.
SvarSletPretty and - if not exactly a lot of work - more work than I felt like giving. In the end it was only my stubborn streak that led me to continue through the last months.
SvarSlet